Time-series science applied to your client's SEO data.
Four rigorous methods, one daily data pipeline. Every result comes with a confidence score or significance test, so the numbers are ready for client reports.
Four questions a normal dashboard can't answer.
What cycles are real?
STL + FFT identifies weekly, biweekly, and monthly patterns, with a confidence score per peak so you can ignore the artifacts.
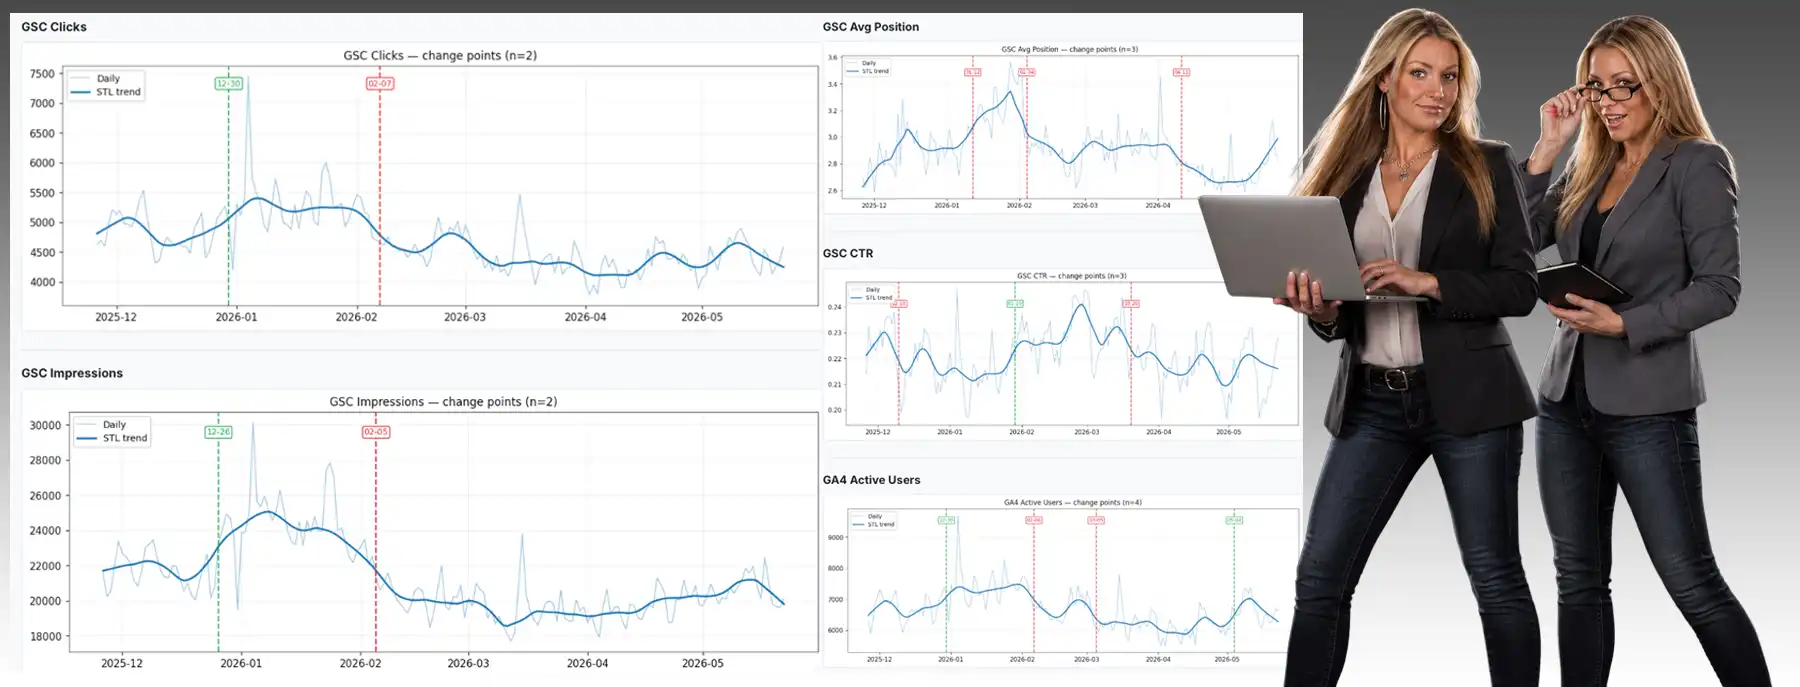
When did the level shift?
PELT pins the exact date a metric stepped up or down, the magnitude in σ, and whether the date aligns with a known Google update.
Does X predict Y?
FFT cross-correlation on STL residuals measures lead/lag between metric pairs with a Bartlett-formula significance threshold.
Did our action cause it?
Synthetic-control causal impact builds a counterfactual from peer domains and reports the lift with a 95% confidence interval.
STL decomposition + targeted FFT
Finds the cycles hiding in daily traffic data: the weekly day-of-week rhythm, biweekly content cadences, monthly campaigns, and anything else that repeats above the noise. The math is two steps. First, STL (Seasonal-Trend decomposition using Loess) splits each metric into a slow trend, a weekly seasonal pattern, and a residual. Then FFT (Fast Fourier Transform) runs on the detrended signal to identify which cycles dominate, with a confidence score on every peak. The result tells you which cycles are real, which days are unusual, and which URLs benefit most from a meta rewrite.
PELT with Google algorithm-update annotation
Pinpoints the exact dates a metric stepped up or down. These are the step-changes a smoothed trend line blurs into noise. The PELT algorithm (Pruned Exact Linear Time) walks the series and finds the optimal set of breakpoints in linear time, so it can run across every metric on every domain without slowing the dashboard. Each detection comes with a magnitude, a direction, and an annotation if the date aligns with a known Google algorithm update, so you can tell platform impact apart from your own changes.
FFT-based lead/lag on STL residuals
Measures whether one metric predicts another, and after how many days. The math runs FFT (Fast Fourier Transform) correlation on STL residuals, so the strong weekly day-of-week pattern doesn't drown out the real signal. A Bartlett-formula significance threshold (the standard test for distinguishing real correlation from random noise) tells you whether the relationship between the two metrics is statistically meaningful, rather than just visually suggestive. Useful for proving that ranking improvements actually drive traffic, or showing that they don't.
Synthetic-control intervention measurement
Estimates how much lift a specific action caused, against a counterfactual built from comparable client domains that didn't have the same intervention. The technique is synthetic control, the same family as Google's CausalImpact library: fit an OLS regression (Ordinary Least Squares, a standard statistical model) on the pre-intervention period, project forward what the focal domain would have done without the change, then measure the gap between actual and projected. Answers "did the rewrite actually work?" with a number and a 95% confidence interval rather than a guess.
Questions analysts ask before trusting a number.
Why use STL residuals instead of raw daily values?
Raw daily SEO metrics share a strong weekly day-of-week pattern. Correlating raw values mostly tells you "both spike on weekdays", which is true but useless. STL strips trend and weekly seasonality first, so downstream methods analyze the anomalous parts of each series, where real signal lives.
How is Causal Impact different from a before/after comparison?
Before/after can't separate your intervention from algorithm updates, seasonality, or anything else happening simultaneously. Causal Impact builds a counterfactual from peer domains without an intervention near the same date. Market-wide effects touch the peers too and get absorbed. The remaining gap is attributable to your action, with a 95% CI.
What are the data requirements?
Frequency and Change-Point need 90+ days per metric. Cross-correlation needs 60+ days of overlap. Causal Impact needs 28+ pre and 14+ post days, plus one peer with no overlapping intervention within ±30 days. Below these thresholds the tool refuses to produce a number rather than fabricate one.
How often does the analysis refresh?
Daily. GSC and GA4 fetchers run nightly, the frequency report rebuilds at 2:30 AM, and change-point / causal-impact analyses run on demand with a 24-hour cache. A manual Refresh button is on every page.
Further reading: Did Your Last SEO Move Actually Work? The Statistics Your Dashboard Doesn't Show.