Call Us Free: 1-888-334-1276

Bias-Controlled Analytics
Complete Ownership and Control Over Your Data

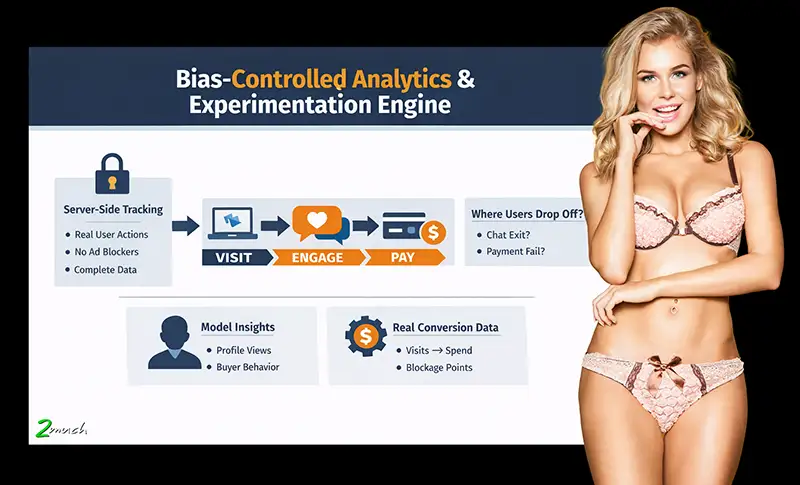
A comprehensive, privacy-focused behavior tracking system that captures and analyzes user journeys across your site. Unlike third-party analytics services, this gives you complete data ownership while providing deep insights into how visitors discover your site, what actions they take, and whether they convert.

Bias-Controlled Analytics Dashboard Interface

Overview

The system tracks every significant user interaction—from the moment someone lands on your homepage through their progression into engaged viewers and eventual buyers. Tracking happens automatically on the server side, requiring no JavaScript or client-side code to function.

This ensures accurate data capture even when users have ad blockers enabled or JavaScript disabled, and maintains attribution across complex scenarios like payment gateway redirects where traditional analytics lose track of users.

The Qualification Funnel

The heart of the system is the Q0-Q4 qualification funnel, which automatically categorizes every visitor into one of five levels based on their behavior. This provides immediate visibility into where users drop off in your conversion process and helps identify which marketing channels drive the most valuable traffic.

Q0 - Bounce: Visitors who leave without viewing any model profiles. Often indicates poor traffic quality or misaligned targeting.
Q1 - Awareness: Visitors who click on a model profile, showing genuine interest in your content.
Q2 - Engagement Intent: Visitors who engage more deeply by opening a chat room, sending a message, or viewing multiple models.
Q3 - Purchase Intent: Visitors who open the checkout page or attempt to add funds to their wallet.
Q4 - Buyer: Visitors who successfully complete a payment, representing your converted customers.

Classification happens automatically in real-time as users interact with your site. Each visitor's qualification level is continuously updated based on their latest actions, with complete attribution information showing which marketing campaign, traffic source, or referrer brought them.

Attribution and Identity Tracking

The system provides sophisticated attribution tracking that persists across the entire user journey. When someone arrives with UTM parameters (such as utm_source=facebook&utm_medium=cpc&utm_campaign=spring2026), those attribution details are captured immediately and stored in secure cookies. Every subsequent event that visitor triggers maintains that same attribution data.

This persistence is particularly important during payment flows. When a user clicks "Proceed to Payment" and gets redirected to an external payment gateway, traditional analytics lose track of that user. The system solves this by storing the visitor's identity and attribution in both cookies and the database, then restoring that context when the payment webhook confirms the transaction.

You can definitively trace a completed purchase back to the exact marketing campaign that brought that customer, even though they left and returned during the payment process. The system tracks three types of identity: visitor keys (assigned before signup), user keys (linked to registered accounts), and model keys (for performer tracking). All use pseudonymous hashing to protect privacy while maintaining the ability to connect events across sessions and devices.

Dashboard and Visualization

The analytics dashboard provides immediate visual insights into funnel performance. The main view displays your Q0-Q4 breakdown as an interactive funnel chart, showing how many visitors fall into each qualification level and what percentage successfully progress from one stage to the next.

Available Views

  • Funnel visualization - Q0-Q4 progression with conversion rates
  • Channel performance - Breakdown by UTM source and medium with revenue, conversion rates, and time to first purchase
  • Model performance - Profile views, chat opens, and revenue per performer
  • Filtering - By date range, marketing channel, device type, or geographic location

The channel performance table shows not just visitor counts but actual revenue generated. You can see that Facebook CPC traffic converts at 3.2% while organic Google traffic converts at 5.8%, allowing you to optimize marketing spend accordingly.

Drilldown and Event Sequences

Clicking on any qualification level in the funnel opens a detailed drilldown view showing every individual visitor in that category. Each visitor appears as a card displaying their attribution information (source, medium, campaign), device type, location, and key behavior metrics like total visits and days to first spend.

Clicking on a specific visitor card opens a modal window showing that person's complete event sequence—every single action they took on your site in chronological order with microsecond-precision timestamps. You can see exactly when they landed, which profiles they viewed, when they opened chat, what they typed, when they clicked "Fund Wallet," and whether their payment succeeded or failed.

This level of detail is valuable for understanding conversion issues. If Q3 to Q4 conversion is low (many people reaching checkout but not completing payment), you can drill into individual Q3 visitors, examine their event sequences, and identify common patterns. Perhaps people are abandoning after seeing the payment processing fee, or there's a technical error during the payment redirect.

Export System

The export functionality allows you to extract analytics data as JSON files for analysis in external tools like Excel, Python, R, or any business intelligence platform.

Export Types

  • Raw events (every captured action)
  • Derived users (per-visitor rollups with qualification levels)
  • Models (performer profiles)
  • Model sessions (streaming session data)
  • Payments (all payment events)

Filtering Options

  • Date range selection
  • Specific hour filtering
  • Individual visitor key
  • Session ID filtering

All exports are privacy-compliant by design. Email addresses, IP addresses, physical addresses, phone numbers, and other personally identifiable information are never included in export files. Data uses pseudonymous keys (visitor_key, user_key, model_key) that allow you to analyze behavior patterns without exposing individual identities. Geographic data is limited to country and region level, and device information only includes broad categories like "desktop" or "mobile."

Events Tracked

The system captures a comprehensive set of events covering navigation, engagement, and conversion. All tracking happens automatically with no additional code required.

Navigation Events

Every page view is tracked through server-side code that runs before any redirects occur, ensuring accurate landing page capture. Model profile views trigger Q1 advancement.

Engagement Events

Chat opens and public messages sent trigger Q2 qualification. These events include the model ID so you can see which performers drive engagement.

Payment Funnel Events

Checkout opens, payment attempts (with amount and currency), payment success (with transaction ID), and payment failures (with reason) are all captured with full attribution maintained throughout the external payment redirect.

Data Control and Analysis

What You Get

  • Raw behavioral data
  • Exportable JSON/CSV formats
  • Complete decision-point tracking
  • Time-series data for trend analysis
  • Independent analysis capability

What You Don't Get

  • AI recommendations
  • Hidden scoring algorithms
  • Opaque funnel modeling
  • Baked-in assumptions
  • Result manipulation

Your data, your analysis, your decisions.

Included with Miricam Enterprise

Bias-Controlled Analytics is fully operational and production-ready, providing the deep behavioral insights needed to optimize marketing, improve conversion rates, and understand which traffic sources drive your most valuable customers.

View Miricam Pricing Contact Sales